Liverpool Plains · NSW · 50 suburbs tracked
Liverpool Plains house prices, 2026.
The median house price in Liverpool Plains is $555,750, the median of 18 suburb medians from verified government sales data. Below: house prices in the busiest suburbs, then the fastest-growing, most affordable and highest-priced suburbs in the Liverpool Plains region of New South Wales.
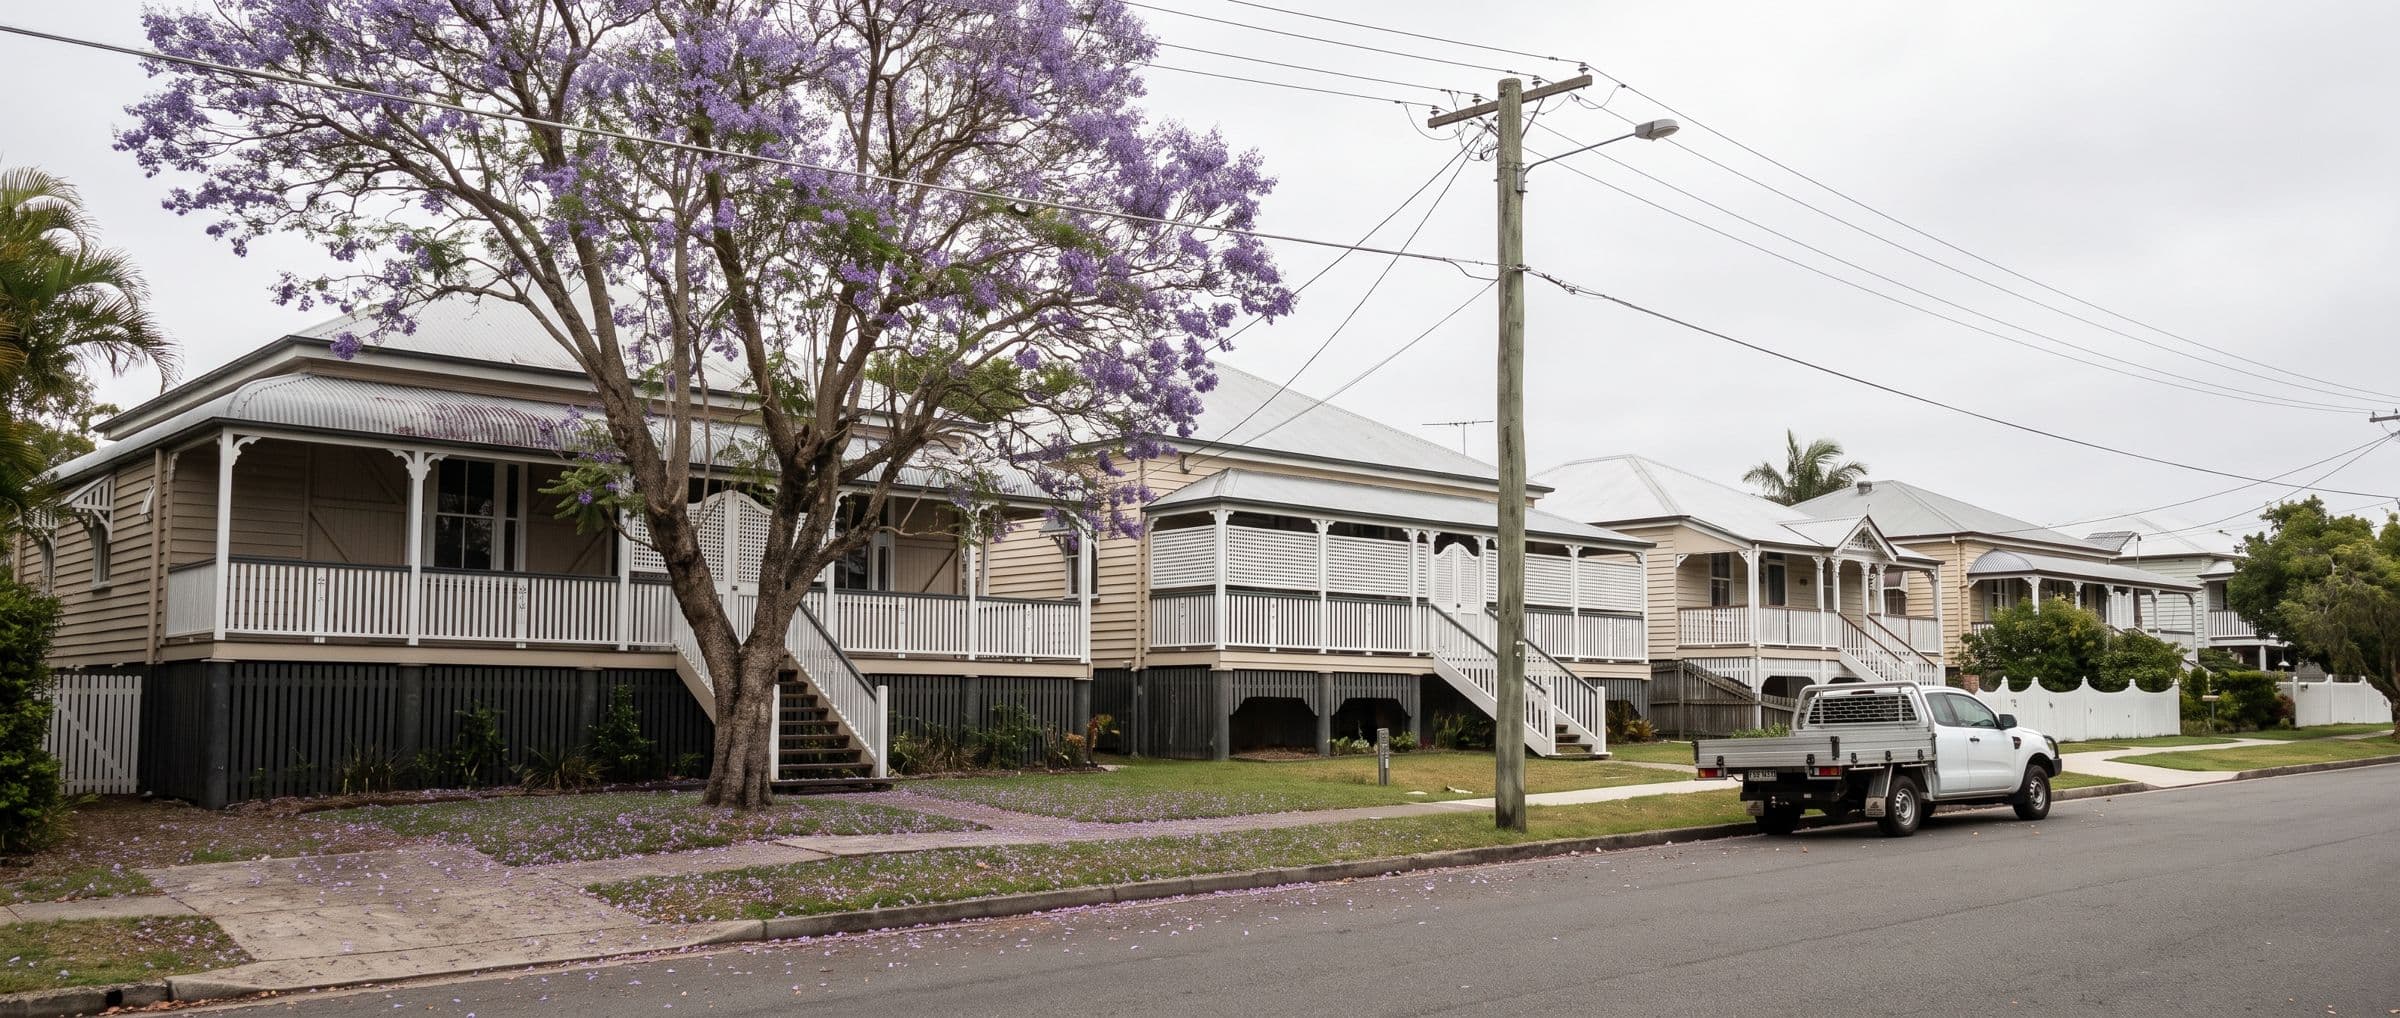
Median house price in Liverpool Plains
Median house
$556K
median of suburb medians
Median unit
$240K
median of suburb medians
Typical annual growth
+5.4%
house prices, last 12 months
Median house rent
$530/wk
weekly, across tracked suburbs
What Liverpool Plains house prices are doing
The median house price across the Liverpool Plains region is $555,750. That figure is the median of 18 suburb medians, each drawn from government sales records, rather than an average, so a handful of waterfront or acreage suburbs cannot drag it up. The median unit price is $240,480. The median house rent is $530 a week.
Over the past twelve months the typical Liverpool Plains suburb rose by 5.4% in median house price. The spread between suburbs is wide: South Tamworth recorded +14.3%, the fastest of the established suburbs with plausible growth data. A change beyond 25% in a year, the mark of a handful of sales, is left out of the growth figures.
Among established suburbs, the most affordable is Moore Creek at $300,000 and the dearest is Calala at $705,000, a 2.4-times gap across the one region. The suburbs with the most recorded house sales in the latest period are South Tamworth (190), Hillvue (156), North Tamworth (147); the table below lists the 8 busiest with their medians.
Source: suburb medians from the NSW valuer-general or state sales records and the ABS, aggregated by Your Property Guide, sales data last refreshed September 2026; page generated 22 October 2026. Only the 18 of 50 tracked suburbs whose own page publishes a median contribute to price figures: a verified sales source, and at least five recorded sales where the count is reported.
House prices by suburb in Liverpool Plains
| # | Suburb | Median price | 12-month change | House sales | Prices |
|---|---|---|---|---|---|
| 1 | South Tamworth2340 | $480,000 | +14.3% | 190 | View → |
| 2 | Hillvue2340 | $678,000 | +9.4% | 156 | View → |
| 3 | North Tamworth2340 | $600,000 | -10.6% | 147 | View → |
| 4 | East Tamworth2340 | $680,000 | +3.4% | 146 | View → |
| 5 | West Tamworth2340 | $425,500 | +13.5% | 123 | View → |
| 6 | Calala2340 | $705,000 | +8.0% | 98 | View → |
| 7 | Oxley Vale2340 | $559,000 | +11.8% | 96 | View → |
| 8 | Moore Creek2340 | $300,000 | - | 91 | View → |
Fastest-growing Liverpool Plains suburbs
| # | Suburb | Median price | 12-month change | Prices |
|---|---|---|---|---|
| 1 | South Tamworth2340 | $480,000 | +14.3% | View → |
| 2 | West Tamworth2340 | $425,500 | +13.5% | View → |
| 3 | Oxley Vale2340 | $559,000 | +11.8% | View → |
| 4 | Hillvue2340 | $678,000 | +9.4% | View → |
| 5 | Calala2340 | $705,000 | +8.0% | View → |
| 6 | East Tamworth2340 | $680,000 | +3.4% | View → |
| 7 | North Tamworth2340 | $600,000 | -10.6% | View → |
Most affordable Liverpool Plains suburbs
| # | Suburb | Median price | 12-month change | Prices |
|---|---|---|---|---|
| 1 | Moore Creek2340 | $300,000 | - | View → |
| 2 | West Tamworth2340 | $425,500 | +13.5% | View → |
| 3 | South Tamworth2340 | $480,000 | +14.3% | View → |
| 4 | Oxley Vale2340 | $559,000 | +11.8% | View → |
| 5 | North Tamworth2340 | $600,000 | -10.6% | View → |
| 6 | Hillvue2340 | $678,000 | +9.4% | View → |
| 7 | East Tamworth2340 | $680,000 | +3.4% | View → |
| 8 | Calala2340 | $705,000 | +8.0% | View → |
Liverpool Plains's highest median prices
| # | Suburb | Median price | Prices |
|---|---|---|---|
| 1 | Calala2340 | $705,000 | View → |
| 2 | East Tamworth2340 | $680,000 | View → |
| 3 | Hillvue2340 | $678,000 | View → |
| 4 | North Tamworth2340 | $600,000 | View → |
| 5 | Oxley Vale2340 | $559,000 | View → |
| 6 | South Tamworth2340 | $480,000 | View → |
| 7 | West Tamworth2340 | $425,500 | View → |
| 8 | Moore Creek2340 | $300,000 | View → |
Real estate agents in Liverpool Plains
Selling in Liverpool Plains? Get matched to one local agent
Tell us the suburb and when you plan to sell. We match you to one agent who sells in that part of Liverpool Plains, with recent sales there, and you decide whether to talk to them. Free for sellers.
Commission in New South Wales typically runs 1.8% to 2.5%. On the Liverpool Plains median of $555,750 that is $10,004 to $13,894, before marketing. Rates are negotiable; see the NSW commission guide.
Liverpool Plains property market questions
- What is the median house price in Liverpool Plains?
- The median house price across the Liverpool Plains region of NSW is $555,750, calculated as the median of 18 suburb-level medians from verified government sales data. The median unit price is $240,480.
- Are Liverpool Plains house prices rising?
- The typical Liverpool Plains suburb recorded growth of 5.4% in house prices over the past 12 months. Growth varies by suburb; the fastest-rising suburbs are listed on this page.
- Which Liverpool Plains suburbs are growing fastest?
- By 12-month house price growth, the fastest-rising suburbs in the Liverpool Plains region in our verified data are South Tamworth, West Tamworth, Oxley Vale. See the table on this page.
- What are the cheapest suburbs in Liverpool Plains?
- Among established suburbs (population 1,000+) with verified sales data, the most affordable suburbs in the Liverpool Plains region by median house price are Moore Creek, West Tamworth, South Tamworth.
Suburbs in Liverpool Plains
All 50 suburbs in the Liverpool Plains region, New South Wales. Medians are shown only where the suburb’s own page publishes one.
Units $240,480
Units $240,480
Units $240,480
Units $240,480
Units $240,480
Units $240,480
Units $240,480
Units $240,480
Units $240,480
Units $240,480
Units $240,480
Units $240,480
Units $240,480
Units $240,480
Units $240,480
Units $240,480
Units $237,600
Units $240,480
Keep exploring
Data source
Figures are aggregated from suburb-level medians sourced from state valuers-general, state government sales records and the ABS. Only suburbs whose own page publishes a median contribute to price figures (18 of 50 tracked Liverpool Plains suburbs): a verified sales source, and at least five recorded sales where the count is reported. A 12-month change is shown where the state’s sales feed measures one, and left out beyond 25%. Full methodology →
Free property appraisal · Start with your suburb
Where’s the house?
We’ll show you what houses in that suburb are selling for, then introduce you to one local agent who sells in your area for a figure on yours. If we don’t have one yet, we’ll tell you. Free, no commitment to list.
Thinking about selling in Liverpool Plains?
Selling a home, the free guide: what it really costs, how agents price your home, the questions to ask before you choose one, and a 12-week plan to settlement. Free PDF, in your inbox in 60 seconds.
Get the free selling guide