Family-friendly ranking · QLD
The best suburbs for families in Queensland.
Suburbs ranked by average school ICSEA score and family-household percentage. Filtered to Queensland suburbs only.
About this ranking
Family-friendly suburbs balance four things: schools you'd actually send your kids to, parks and bike paths that get used, walkable neighbourhood retail, and a price point that doesn't lock you out of upgrading rooms when the family grows. We rank by the strongest measurable proxy (school ICSEA) and weight by the share of households that are families with dependents.
Queensland property market in 2026
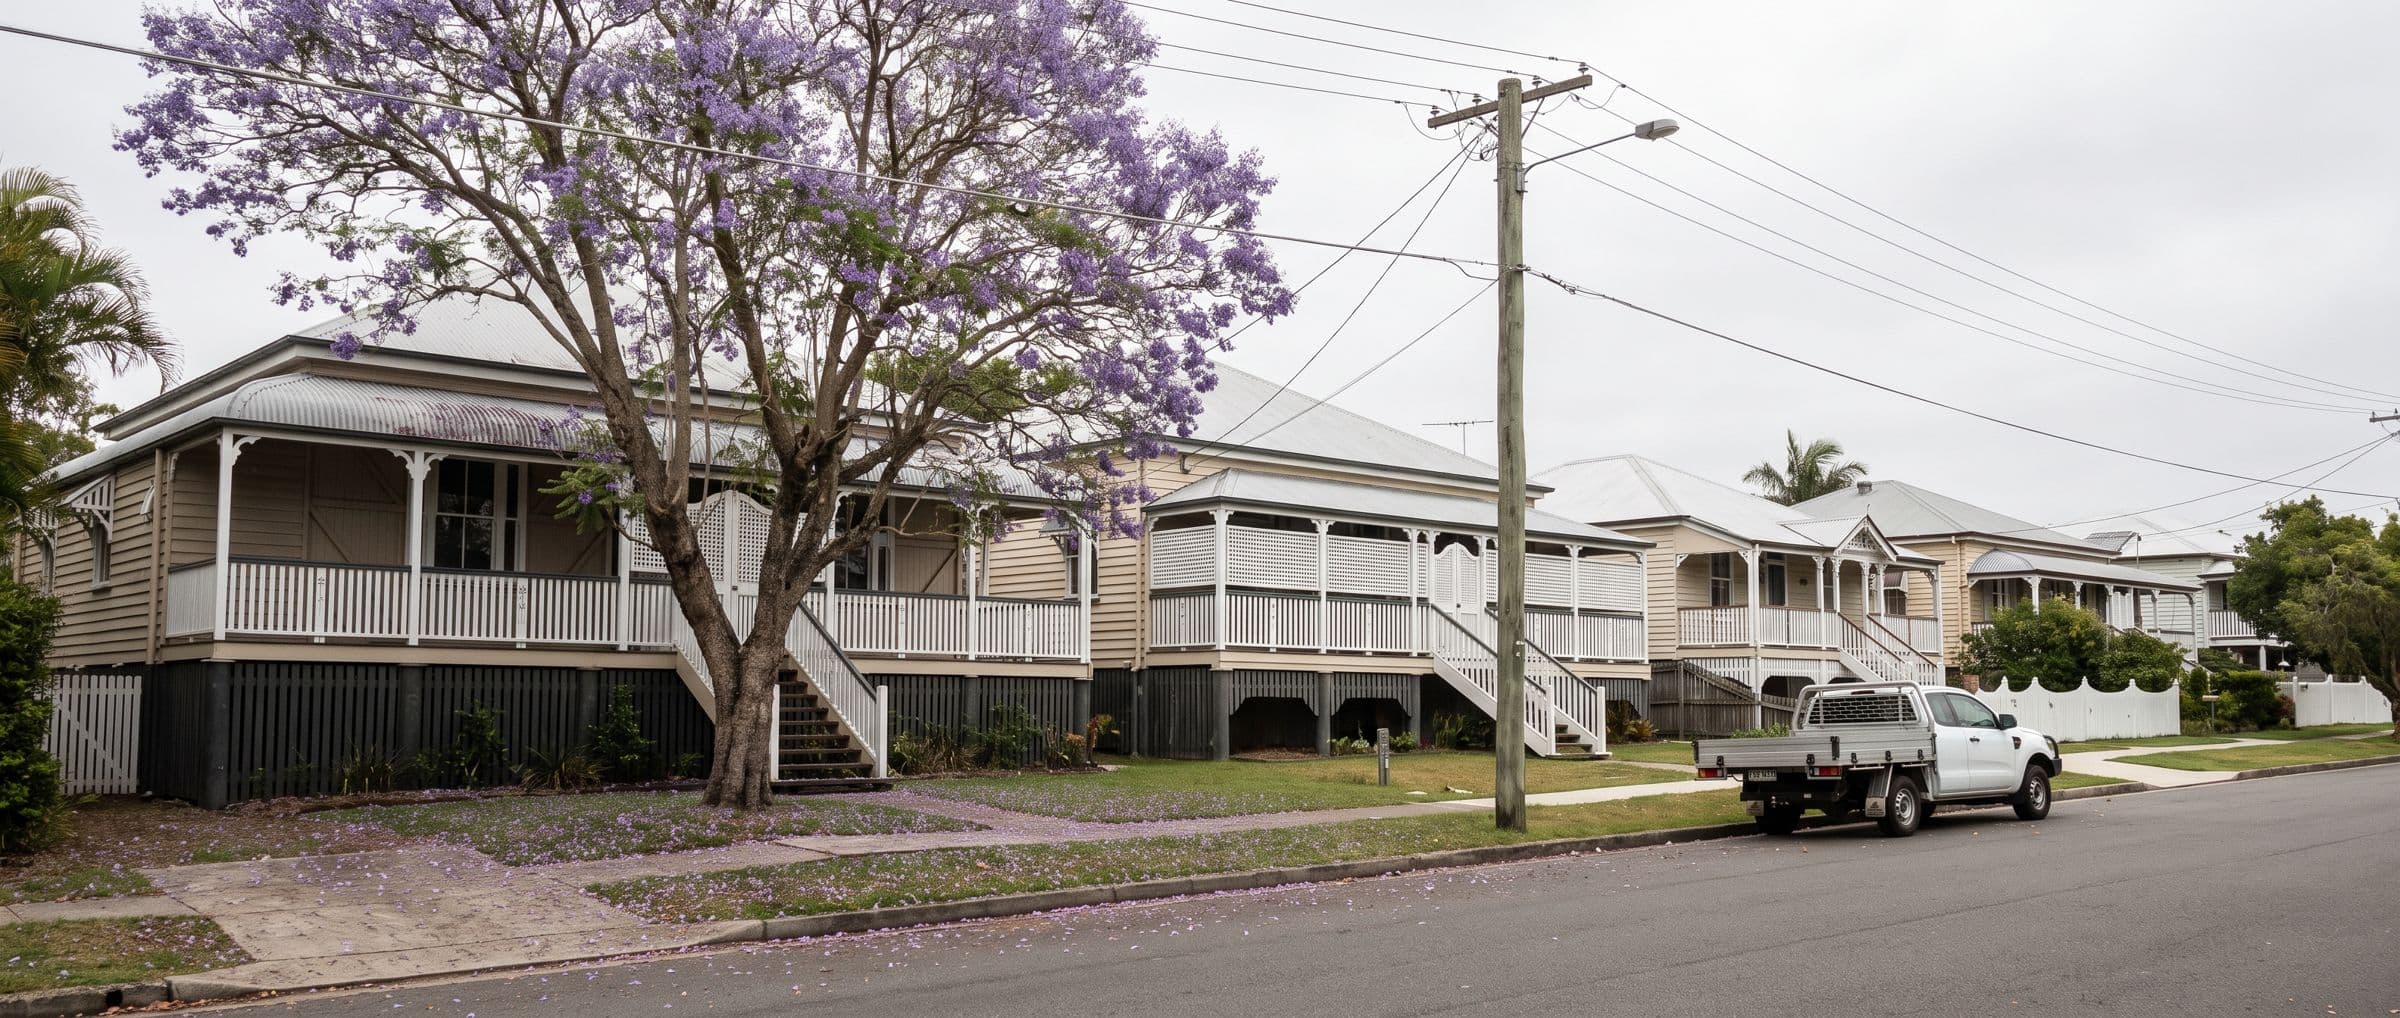
Queensland has been Australia's standout performer over the last five years, driven by interstate migration from Sydney and Melbourne plus infrastructure investment leading up to the 2032 Olympics. Brisbane's median house price has compounded around 8-10% annually since 2020. The Gold Coast and Sunshine Coast have followed the same trajectory but with more cyclicality, and the Moreton Bay corridor (Caboolture, North Lakes, Burpengary) now offers genuine value for buyers priced out of inner Brisbane. Regional Queensland (Townsville, Cairns, Toowoomba) has lifted off years of stagnation and is now solidly positive.
Buyer tip, QLD
Queensland's first home buyer stamp duty concession was upgraded to $700K full exemption in mid-2024, among the most generous in the country. Combine that with the federal Home Guarantee Scheme and you can be in a $700K Brisbane house with $35K of saved deposit and effectively zero stamp duty.Watch out, QLD
Flood overlays are highly localised in Brisbane and SEQ. The 2011 and 2022 floods affected specific creek systems, and properties on adjacent streets can have wildly different insurance premiums and resale values. Always check the Brisbane City Council Flood Awareness Map for the exact address before bidding.Methodology
Suburbs are scored on average ICSEA across primary and secondary schools (sourced from ACARA), filtered to suburbs where families with dependents make up at least 40% of households (ABS Census 2021). Population-weighted to avoid outliers from very small localities.Best for
First home buyers planning to start a family in the next 5 years; existing families upsizing into a longer-term home; relocating families researching new areas.
Showing top 50 suburbs in Queensland
QLD 4067
Avg ICSEA
1,178
Family HH %
55%
View profile →
QLD 4068
Avg ICSEA
1,149
Family HH %
67%
View profile →
QLD 4075
Avg ICSEA
1,142
Family HH %
80%
View profile →
QLD 4069
Avg ICSEA
1,132
Family HH %
92%
View profile →
QLD 4030
Avg ICSEA
1,129
Family HH %
58%
View profile →
QLD 4556
Avg ICSEA
1,124
Family HH %
73%
View profile →
QLD 4156
Avg ICSEA
1,118
Family HH %
88%
View profile →
QLD 4152
Avg ICSEA
1,110
Family HH %
80%
View profile →
QLD 4069
Avg ICSEA
1,106
Family HH %
84%
View profile →
QLD 4520
Avg ICSEA
1,100
Family HH %
77%
View profile →
QLD 4123
Avg ICSEA
1,093
Family HH %
88%
View profile →
QLD 4228
Avg ICSEA
1,089
Family HH %
87%
View profile →
QLD 4562
Avg ICSEA
1,089
Family HH %
85%
View profile →
QLD 4012
Avg ICSEA
1,087
Family HH %
51%
View profile →
QLD 4109
Avg ICSEA
1,087
Family HH %
78%
View profile →
QLD 4179
Avg ICSEA
1,074
Family HH %
77%
View profile →
QLD 4520
Avg ICSEA
1,072
Family HH %
93%
View profile →
QLD 4551
Avg ICSEA
1,066
Family HH %
76%
View profile →
QLD 4551
Avg ICSEA
1,065
Family HH %
74%
View profile →
QLD 4179
Avg ICSEA
1,061
Family HH %
77%
View profile →
QLD 4213
Avg ICSEA
1,060
Family HH %
81%
View profile →
QLD 4034
Avg ICSEA
1,059
Family HH %
68%
View profile →
QLD 4870
Avg ICSEA
1,055
Family HH %
45%
View profile →
QLD 4562
Avg ICSEA
1,052
Family HH %
84%
View profile →
QLD 4053
Avg ICSEA
1,051
Family HH %
61%
View profile →
QLD 4207
Avg ICSEA
1,046
Family HH %
90%
View profile →
QLD 4205
Avg ICSEA
1,043
Family HH %
62%
View profile →
QLD 4702
Avg ICSEA
1,039
Family HH %
81%
View profile →
QLD 4702
Avg ICSEA
1,038
Family HH %
71%
View profile →
QLD 4158
Avg ICSEA
1,037
Family HH %
67%
View profile →
QLD 4217
Avg ICSEA
1,035
Family HH %
51%
View profile →
QLD 4078
Avg ICSEA
1,034
Family HH %
79%
View profile →
QLD 4702
Avg ICSEA
1,031
Family HH %
93%
View profile →
QLD 4670
Avg ICSEA
1,031
Family HH %
79%
View profile →
QLD 4211
Avg ICSEA
1,029
Family HH %
87%
View profile →
QLD 4560
Avg ICSEA
1,028
Family HH %
78%
View profile →
QLD 4819
Avg ICSEA
1,027
Family HH %
62%
View profile →
QLD 4017
Avg ICSEA
1,020
Family HH %
81%
View profile →
QLD 4558
Avg ICSEA
1,018
Family HH %
77%
View profile →
QLD 4503
Avg ICSEA
1,015
Family HH %
81%
View profile →
QLD 4275
Avg ICSEA
1,012
Family HH %
80%
View profile →
QLD 4821
Avg ICSEA
1,010
Family HH %
45%
View profile →
QLD 4280
Avg ICSEA
1,008
Family HH %
85%
View profile →
QLD 4341
Avg ICSEA
1,007
Family HH %
77%
View profile →
QLD 4627
Avg ICSEA
1,005
Family HH %
88%
View profile →
QLD 4350
Avg ICSEA
1,004
Family HH %
72%
View profile →
QLD 4802
Avg ICSEA
1,001
Family HH %
67%
View profile →
QLD 4878
Avg ICSEA
998
Family HH %
55%
View profile →
QLD 4518
Avg ICSEA
998
Family HH %
81%
View profile →
QLD 4507
Avg ICSEA
996
Family HH %
80%
View profile →
Common questions
About this ranking
What is ICSEA and why does it matter?
ICSEA (Index of Community Socio-Educational Advantage) is ACARA's measure of the educational backgrounds of students at a school, used as a proxy for school resourcing and outcomes. Higher ICSEA generally correlates with stronger NAPLAN performance and higher senior-year retention. We use it because it's published consistently across all Australian schools, but it's not a direct quality measure, so always verify with site visits and NAPLAN data.
Why don't you rank by NAPLAN scores directly?
NAPLAN scores are published by My School (ACARA) but reproducing them in rankings is restricted. ICSEA is the next-best public proxy and correlates strongly with NAPLAN outcomes for like-for-like school cohorts.
How do school catchments affect this ranking?
We rank suburbs by the average ICSEA of schools located in or directly serving the suburb. Catchment boundaries cut through suburbs, so two houses on the same street can fall into different catchments. Always verify the in-catchment school for the specific address before making an offer.
Shortlisted a suburb? Buy it well.
Buying a home, the free guide: what you can actually spend, the 2026 schemes for your state, how homes are marketed and sold, and a 12-week plan from pre-approval to keys. Free PDF, in your inbox in 60 seconds.
Get the free buying guide